I have entered Long on AAPL @ 525 11/16/12.
Target 20MA @575 9.5% Gain
Stop loss @ Close below 505 3.8% Loss
Risk / Reward: 20$loss to 50$gain
PLEASE CLICK ON THE PICTURE TO GET A FULL SIZE VIEW
- Max Move Extension from 20 Ma
- 21 Count multiple of 7, also a minor 9 count
- Bottoming Tail
- Nice pivot low support back from Mar' 12

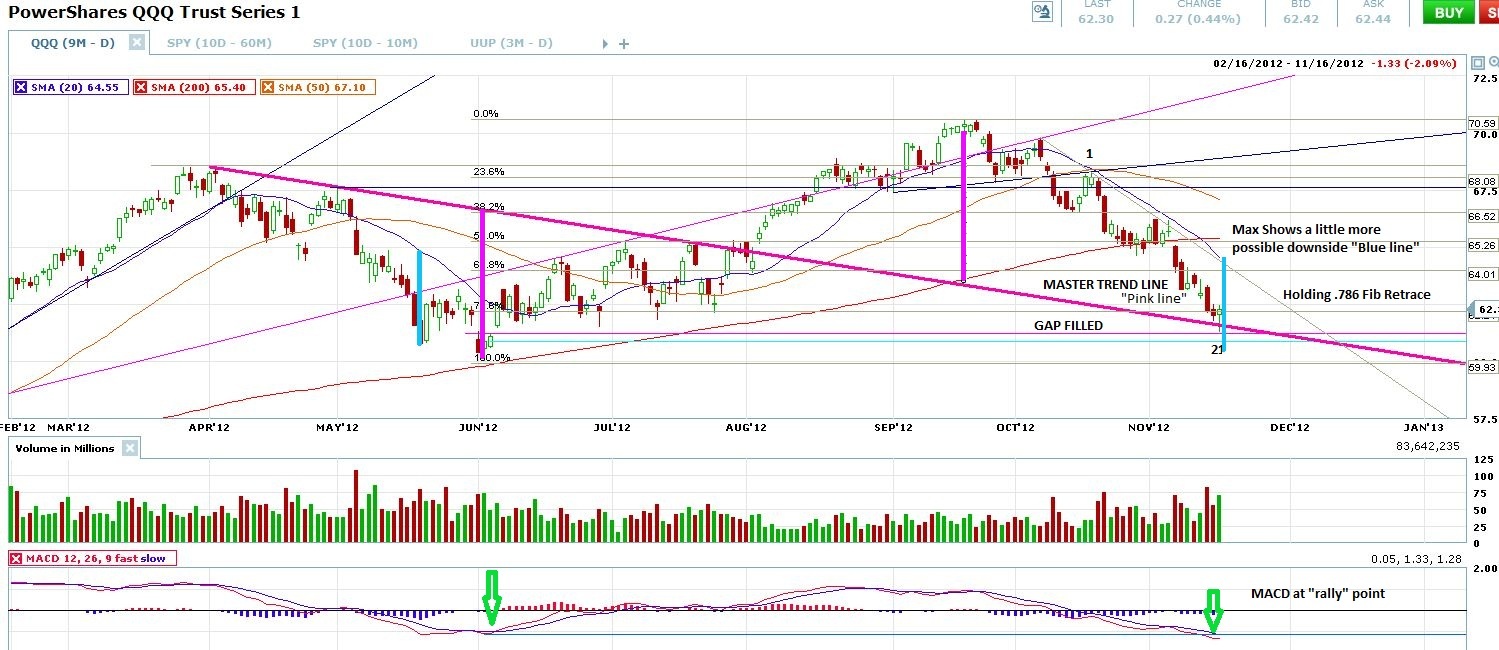
PLEASE CLICK ON THE PICTURE TO GET A FULL SIZE VIEW
- Master Trend line from April / May / Aug highs. now backesting first touch. Strong Support
- Amazing Symetry off this Trend as to show the Highs and lows over the past few year. Purp*
- 21 count with minor 9 count.
- MACD at "rally point"
- .786 Retrace Holding
- Gap Filled


 II Am Holding a few KO PUTS (JULY ) picked up with breach of head and shoulders.


